Build a Real‑Time Cash Flow Dashboard for Small Businesses
Why Real‑Time Cash Flow Matters for Small Businesses
Running a small business means every dollar counts. A real‑time cash‑flow dashboard gives you an up‑to‑the‑minute view of liquidity, helping you avoid nasty surprises like missed payroll or overdraft fees. By consolidating actual balances with short‑term forecasts, you can see whether you have enough cash to cover upcoming expenses, repay debt, or invest in growth.
Core Metrics to Track
Consolidated Actual & Forecast Cash Position
This metric combines the current bank balance with projected inflows and outflows for the next 30‑90 days. It provides a single‑source view of liquidity, letting you spot cash shortfalls before they become crises. Read more about this approach.
Total Actual & Forecast Available Liquidity
Beyond cash on hand, include credit lines and short‑term investments. Knowing the full amount you can draw on prevents unnecessary borrowing and improves negotiating power with suppliers. Details from Ripple Treasury.
Net Debt & Covenant Compliance
Debt ratios and covenant limits are directly impacted by cash movements. A sudden dip can trigger penalties or higher interest rates. Monitoring net debt alongside cash flow ensures you stay within agreed terms.
Cash Burn Rate & Runway
Calculate daily or weekly spend versus cash on hand. This tells you how many days you can operate without new revenue—a vital number for startups and seasonal businesses.
Days Sales Outstanding (DSO) & Receivables Aging
High DSO indicates delayed customer payments, which can choke cash flow. Tracking receivables aging helps you prioritize collection efforts.
Setting Up Your Dashboard
Choose the Right Tool
Select a platform that integrates with your accounting software (e.g., QuickBooks, Xero) and can pull bank transaction data via APIs. Many modern BI tools offer pre‑built cash‑flow templates that you can customize.
Connect Data Sources
- Bank accounts – Use secure read‑only API connections.
- Credit lines – Pull available balances from lender portals.
- Short‑term investments – Import market values from brokerage statements.
- Accounts receivable/payable – Sync with your invoicing system.
Build the Visual Layout
- Top‑level KPI bar: Show consolidated cash position, burn rate, and runway.
- Liquidity waterfall: Visualize cash, credit, and investments as stacked bars.
- Trend line: Plot forecast vs. actual cash over the next 90 days.
- Alert panel: Highlight any metric breaching predefined thresholds.
Configuring Alerts That Actually Work
Define Meaningful Thresholds
- Liquidity cushion: Trigger an alert when available liquidity falls below 2 × monthly operating expenses.
- Burn rate spike: Notify you if daily spend exceeds the 7‑day moving average by more than 15 %.
- Covenant breach risk: Flag when net debt approaches 80 % of the covenant limit.
Choose Delivery Channels
Use a combination of email, Slack, or SMS so the right team members see the warning instantly. For example, finance leads get email summaries, while the CEO receives SMS for critical breaches.
Test and Refine
Run a simulation using historical data to see how alerts would have fired. Adjust thresholds to reduce noise—too many false alarms cause alert fatigue.
Practical Tips for Small‑Business Operators
- Start simple – Begin with the three most vital metrics (cash position, burn rate, runway) and expand as you get comfortable.
- Automate data pulls – Schedule nightly syncs so you always work with the latest numbers.
- Review weekly – Hold a short “cash‑flow stand‑up” each week to discuss any alerts and decide on corrective actions.
- Document assumptions – Keep a log of forecast assumptions (e.g., expected sales, payment terms) so you can trace why forecasts shift.
- Leverage existing content – Our guide on automating expense reporting approval shows how to reduce manual entry, freeing up time for cash‑flow analysis.
Integrating with Other Business Processes
A cash‑flow dashboard isn’t a silo; it should feed into budgeting, fundraising, and strategic planning. When you spot a cash shortfall, you can quickly evaluate options:
- Accelerate collections – Offer early‑payment discounts.
- Adjust spend – Pause non‑essential purchases.
- Secure bridge financing – Use the dashboard data to justify a short‑term loan.
Common Pitfalls to Avoid
- Over‑reliance on static forecasts – Update forecasts regularly; market conditions change fast.
- Ignoring credit line utilization – Treat credit as part of liquidity, but monitor interest costs.
- Setting thresholds too tight – Leads to constant alerts and eventual desensitization.
- Not involving the whole team – Finance alone can’t act on alerts; involve operations and sales for a coordinated response.
Real‑World Example (Illustrative)
Imagine a SaaS startup with $150k cash, a $50k credit line, and $30k in short‑term investments. Their dashboard shows:
- Consolidated cash position: $230k (actual) vs. $210k (30‑day forecast).
- Burn rate: $5k/day, runway: 46 days.
- Net debt: $80k, covenant limit: $120k (67 % utilization). An alert fires when the forecasted cash dips to $180k, prompting the CEO to negotiate a $25k invoice discount with a key client, extending runway by five days.
Next Steps
- Map your data sources – List every account, credit line, and investment you need to track.
- Select a dashboard platform – Look for integrations with your accounting software.
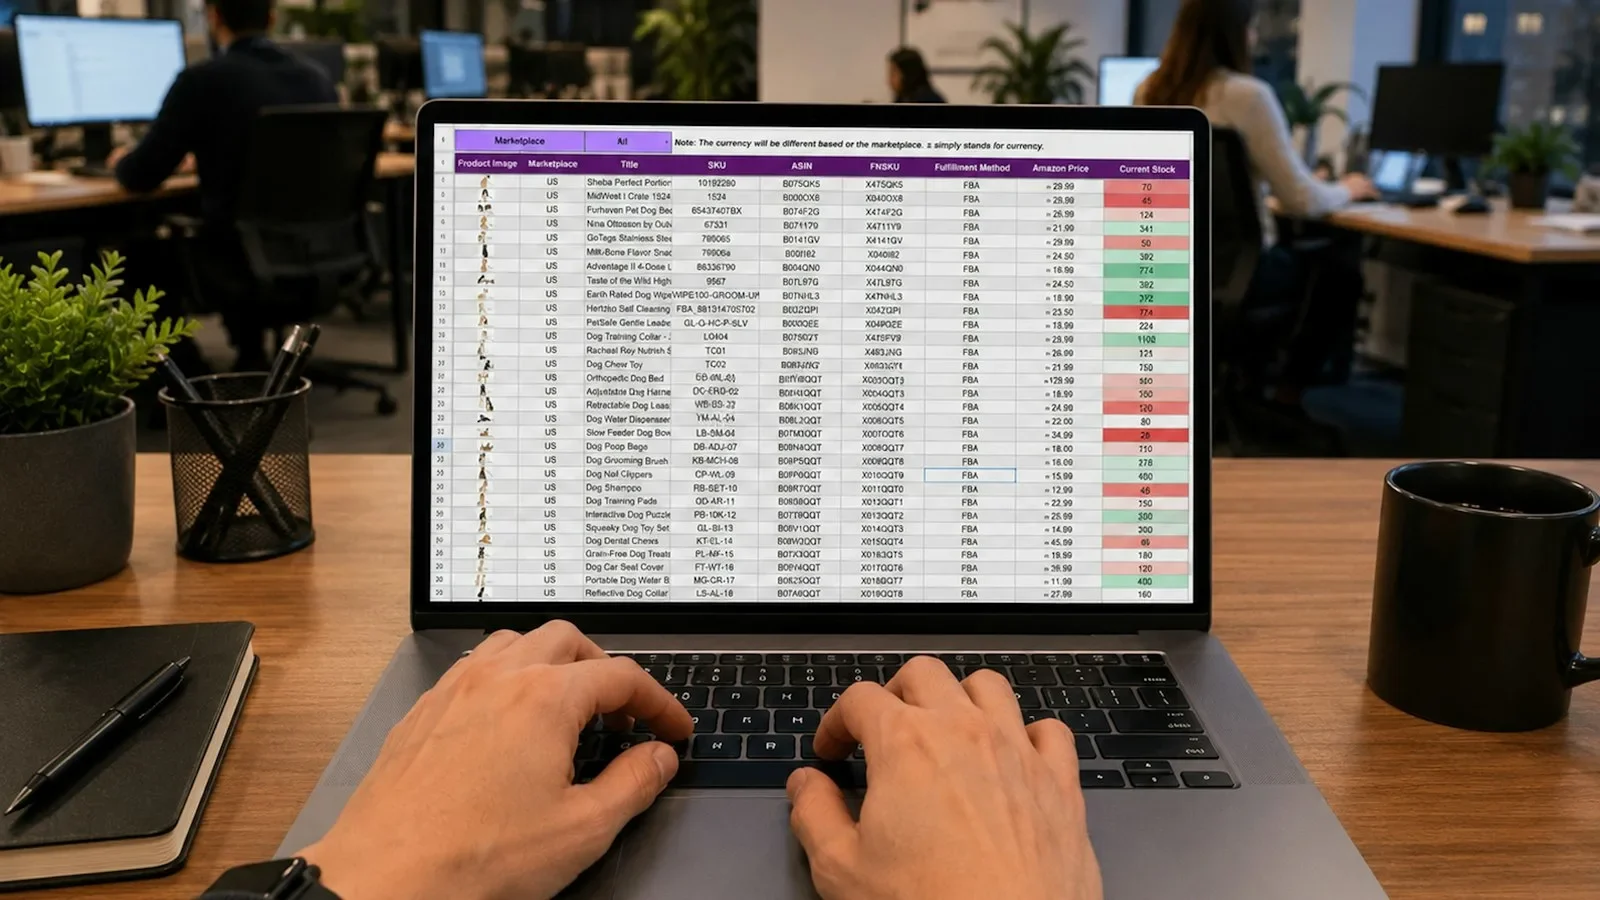
- Build a prototype – Use a spreadsheet or BI tool to visualize the core metrics.
- Set thresholds and alerts – Start with conservative values and refine.
- Schedule a weekly review – Make cash‑flow health a standing agenda item.
By following this roadmap, small‑business owners can turn raw financial data into actionable insight, reduce financial risk, and make faster, more confident decisions.
Further Reading
- Automate Expense Reporting Approval for Small Business 2026 – Learn how automation reduces manual entry and improves data accuracy. U Tech Automations
- Project Cost Tracking Automation – A practical guide on linking time‑tracking with QuickBooks for better budgeting. U Tech Automations
Sources and further reading
Use these primary references when checking the guidance above:
Sources
- Automate Expense Reporting Approval for Small Business 2026 — U Tech Automations
- How to Choose the Right Metrics for Your Cash Flow Dashboard — treasury.ripple.com
- Real-time Cash Flow Dashboard for an Agile Treasury - Quoreka — quoreka.com
- Cash Management Dashboards and What KPIs to Track — inetsoft.com
- Cash Flow Dashboard Example | Klipfolio — klipfolio.com
- Cash Flow Dashboard Example & Template - Build Yours in Minutes — coefficient.io
- Cash Flow Dashboard Example | Geckoboard — geckoboard.com
- Your Cash Flow Dashboard, Every Dollar In and Out Accounted For | Definite
This article was generated through WorkSteady's editorial workflow. Review the cited sources before acting on legal, tax, or financial topics.
Get a direct answer for your business.
Tell WorkSteady what is happening and get one practical action you can take today.